
Adrian, Oregon
Adrian, Oregon | |
|---|---|
 Event at school grounds in Adrian | |
 Location in Oregon | |
| Coordinates: 43°44′23″N 117°4′15″W / 43.73972°N 117.07083°W | |
| Country | United States |
| State | Oregon |
| County | Malheur |
| Incorporated | 1972 |
| Government | |
| • Mayor | M. Adele Dockter |
| Area | |
| • Total | 0.24 sq mi (0.63 km2) |
| • Land | 0.24 sq mi (0.63 km2) |
| • Water | 0.00 sq mi (0.00 km2) |
| Elevation | 2,225 ft (678 m) |
| Population | |
| • Total | 157 |
| • Density | 643.44/sq mi (248.28/km2) |
| Time zone | UTC-7 (Mountain) |
| • Summer (DST) | UTC-6 (Mountain) |
| ZIP code | 97901 |
| Area code | 541 |
| FIPS code | 41-00500[3] |
| GNIS feature ID | 1135989[4] |
Adrian is a city in Malheur County, Oregon, United States, near the confluence of the Snake River and the Owyhee River. The population was 177 at the 2010 census. It is part of the Ontario, OR–ID Micropolitan Statistical Area.
History[edit]

In 1913, Oregon Short Line Railroad built a branch into this part of Malheur County.[5] There was a post office called Riverview on the east side of the Snake River and because the railroad did not want a station of the same name on the west side, the name Adrian was suggested by Reuben McCreary, who platted the townsite.[5] The name was chosen to honor his birthplace, Adrian, Illinois.[5] Riverview post office was established in 1911, but moved across the river in 1915 and the name changed to Adrian in 1919.[5] It was previously thought that the city was named for James Adrian, a sheep rancher, but he did not arrive in the area until 1916.[5]
Adrian is located on the Southern Alternate route of the Oregon Trail, a longer route that eliminated the need to cross the Snake River.[6]
Geography[edit]
According to the United States Census Bureau, the city has a total area of 0.24 square miles (0.62 km2), all of it land.[7]
Climate[edit]
According to the Köppen Climate Classification system, Adrian has a semi-arid climate, abbreviated "BSk" on climate maps.[8]
| Climate data for Adrian, Oregon (Owyhee Dam), 1991–2020 normals, extremes 1935–present | |||||||||||||
|---|---|---|---|---|---|---|---|---|---|---|---|---|---|
| Month | Jan | Feb | Mar | Apr | May | Jun | Jul | Aug | Sep | Oct | Nov | Dec | Year |
| Record high °F (°C) | 67 (19) |
70 (21) |
81 (27) |
92 (33) |
102 (39) |
110 (43) |
112 (44) |
111 (44) |
103 (39) |
93 (34) |
80 (27) |
70 (21) |
112 (44) |
| Mean maximum °F (°C) | 54.7 (12.6) |
60.0 (15.6) |
70.7 (21.5) |
81.8 (27.7) |
91.7 (33.2) |
99.0 (37.2) |
105.7 (40.9) |
103.5 (39.7) |
96.6 (35.9) |
84.9 (29.4) |
66.8 (19.3) |
56.8 (13.8) |
106.2 (41.2) |
| Mean daily maximum °F (°C) | 39.8 (4.3) |
47.3 (8.5) |
57.4 (14.1) |
64.7 (18.2) |
74.6 (23.7) |
83.5 (28.6) |
94.8 (34.9) |
93.2 (34.0) |
82.5 (28.1) |
67.5 (19.7) |
50.4 (10.2) |
40.4 (4.7) |
66.3 (19.1) |
| Daily mean °F (°C) | 30.5 (−0.8) |
35.7 (2.1) |
43.5 (6.4) |
49.6 (9.8) |
58.4 (14.7) |
65.5 (18.6) |
74.7 (23.7) |
73.2 (22.9) |
63.8 (17.7) |
51.5 (10.8) |
38.3 (3.5) |
30.8 (−0.7) |
51.3 (10.7) |
| Mean daily minimum °F (°C) | 21.2 (−6.0) |
24.1 (−4.4) |
29.5 (−1.4) |
34.6 (1.4) |
42.2 (5.7) |
47.5 (8.6) |
54.5 (12.5) |
53.2 (11.8) |
45.1 (7.3) |
35.6 (2.0) |
26.1 (−3.3) |
21.2 (−6.0) |
36.2 (2.4) |
| Mean minimum °F (°C) | 7.9 (−13.4) |
13.8 (−10.1) |
20.6 (−6.3) |
25.5 (−3.6) |
32.1 (0.1) |
39.4 (4.1) |
47.8 (8.8) |
45.0 (7.2) |
35.6 (2.0) |
24.4 (−4.2) |
14.5 (−9.7) |
9.2 (−12.7) |
3.2 (−16.0) |
| Record low °F (°C) | −22 (−30) |
−13 (−25) |
11 (−12) |
14 (−10) |
24 (−4) |
34 (1) |
35 (2) |
35 (2) |
27 (−3) |
11 (−12) |
−4 (−20) |
−16 (−27) |
−22 (−30) |
| Average precipitation inches (mm) | 1.06 (27) |
0.71 (18) |
0.77 (20) |
0.84 (21) |
1.14 (29) |
0.85 (22) |
0.39 (9.9) |
0.21 (5.3) |
0.40 (10) |
0.54 (14) |
0.77 (20) |
1.09 (28) |
8.77 (224.2) |
| Average snowfall inches (cm) | 2.1 (5.3) |
0.6 (1.5) |
0.1 (0.25) |
0.0 (0.0) |
0.0 (0.0) |
0.0 (0.0) |
0.0 (0.0) |
0.0 (0.0) |
0.0 (0.0) |
0.0 (0.0) |
0.1 (0.25) |
3.1 (7.9) |
6.0 (15) |
| Average precipitation days (≥ 0.01 in) | 9.2 | 7.3 | 7.9 | 8.2 | 8.6 | 5.3 | 2.6 | 1.9 | 3.2 | 4.8 | 8.1 | 10.0 | 77.1 |
| Average snowy days (≥ 0.1 in) | 1.0 | 0.7 | 0.1 | 0.0 | 0.0 | 0.0 | 0.0 | 0.0 | 0.0 | 0.0 | 0.2 | 1.6 | 3.6 |
| Source 1: NOAA[9] | |||||||||||||
| Source 2: National Weather Service[10] | |||||||||||||
Demographics[edit]
| Census | Pop. | Note | %± |
|---|---|---|---|
| 1980 | 162 | — | |
| 1990 | 131 | −19.1% | |
| 2000 | 147 | 12.2% | |
| 2010 | 177 | 20.4% | |
| 2020 | 157 | −11.3% | |
| U.S. Decennial Census[11][2] | |||
2010 census[edit]
As of the census of 2010, there were 177 people, 70 households, and 45 families residing in the city. The population density was 737.5 inhabitants per square mile (284.8/km2). There were 78 housing units at an average density of 325.0 per square mile (125.5/km2). The racial makeup of the city was 89.8% White, 0.6% Native American, 1.1% Asian, 2.8% from other races, and 5.6% from two or more races. Hispanic or Latino of any race were 27.1% of the population.[3]
There were 70 households, of which 25.7% had children under the age of 18 living with them, 55.7% were married couples living together, 7.1% had a female householder with no husband present, 1.4% had a male householder with no wife present, and 35.7% were non-families. 27.1% of all households were made up of individuals, and 17.1% had someone living alone who was 65 years of age or older. The average household size was 2.53 and the average family size was 3.20.[3]
The median age in the city was 44.4 years. 22% of residents were under the age of 18; 6.2% were between the ages of 18 and 24; 24.2% were from 25 to 44; 24.8% were from 45 to 64; and 22.6% were 65 years of age or older. The gender makeup of the city was 49.2% male and 50.8% female.[3]
2000 census[edit]
As of the census of 2000, there were 147 people, 59 households, and 38 families residing in the city. The population density was 597.0 inhabitants per square mile (230.5/km2). There were 66 housing units at an average density of 268.0 per square mile (103.5/km2). The racial makeup of the city was 85.03% White, 0.68% Native American, 10.88% from other races, and 3.40% from two or more races. Hispanic or Latino of any race were 14.97% of the population.[3]
There were 59 households, out of which 25.4% had children under the age of 18 living with them, 52.5% were married couples living together, 11.9% had a female householder with no husband present, and 33.9% were non-families. 30.5% of all households were made up of individuals, and 13.6% had someone living alone who was 65 years of age or older. The average household size was 2.49 and the average family size was 3.21.[3]
In the city, the population was spread out, with 25.9% under the age of 18, 9.5% from 18 to 24, 22.4% from 25 to 44, 21.8% from 45 to 64, and 20.4% who were 65 years of age or older. The median age was 38 years. For every 100 females, there were 72.9 males. For every 100 females age 18 and over, there were 84.7 males.[3]
The median income for a household in the city was $30,000, and the median income for a family was $38,438. Males had a median income of $31,250 versus $26,667 for females. The per capita income for the city was $10,740. There were 17.8% of families and 8.0% of the population living below the poverty line, including 3.1% of under eighteens and 22.5% of those over 64.[3]
Education[edit]
It is a part of the Adrian School District[12]
- Adrian Elementary and Middle School
- Adrian High School

Transportation[edit]
Several highways originate, terminate or pass through Adrian:
- Idaho Route 18
- Oregon Route 201
- Oregon Route 452
- Oregon Route 453
- Oregon Route 454
References[edit]
- ^ "ArcGIS REST Services Directory". United States Census Bureau. Retrieved October 12, 2022.
- ^ a b "Census Population API". United States Census Bureau. Retrieved October 12, 2022.
- ^ a b c d e f g h "U.S. Census website". United States Census Bureau. Retrieved December 21, 2012.
- ^ "US Board on Geographic Names". United States Geological Survey. October 25, 2007. Retrieved January 31, 2008.
- ^ a b c d e McArthur, Lewis A.; Lewis L. McArthur (2003) [1928]. Oregon Geographic Names (Seventh ed.). Portland, Oregon: Oregon Historical Society Press. pp. 8–9. ISBN 0-87595-277-1.
- ^ "Old Fort Boise". Archived from the original on February 8, 2007. Retrieved March 3, 2007.
- ^ "US Gazetteer files 2010". United States Census Bureau. Archived from the original on January 25, 2012. Retrieved December 21, 2012.
- ^ Climate Summary for Adrian, Oregon
- ^ "U.S. Climate Normals Quick Access – Station: Owyhee Dam, OR". National Oceanic and Atmospheric Administration. Retrieved June 16, 2023.
- ^ "NOAA Online Weather Data – NWS Boise". National Weather Service. Retrieved June 16, 2023.
- ^ "Census of Population and Housing". Census.gov. Retrieved June 4, 2015.
- ^ "2020 CENSUS - SCHOOL DISTRICT REFERENCE MAP: Malheur County, OR" (PDF). U.S. Census Bureau. Retrieved July 15, 2022.
External links[edit]
Municipalities and communities of Malheur County, Oregon, United States | ||
|---|---|---|
| Cities | 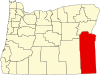 | |
| CDPs | ||
| Other communities | ||
| Ghost town | ||
| Indian reservation | ||
| Footnotes | ‡This populated place also has portions in an adjacent county or counties | |
| International | |
|---|---|
| National | |