
Leslie County, Kentucky
Leslie County | |
|---|---|
 Leslie County courthouse in Hyden | |
 Flag | |
 Location within the U.S. state of Kentucky | |
 Kentucky's location within the U.S. | |
| Coordinates: 37°05′N 83°23′W / 37.09°N 83.38°W | |
| Country | |
| State | |
| Founded | 1878 |
| Named for | Preston Leslie |
| Seat | Hyden |
| Largest city | Hyden |
| Area | |
| • Total | 404 sq mi (1,050 km2) |
| • Land | 401 sq mi (1,040 km2) |
| • Water | 3.6 sq mi (9 km2) 0.9% |
| Population (2020) | |
| • Total | 10,513 |
| • Estimate (2023) | 9,864 |
| • Density | 26/sq mi (10/km2) |
| Time zone | UTC−5 (Eastern) |
| • Summer (DST) | UTC−4 (EDT) |
| Congressional district | 5th |
| Website | www |
Leslie County is located in the U.S. state of Kentucky. Its county seat and largest city is Hyden.[1] As of the 2020 census, the population was 10,513.[2] It was formed in 1878 from portions of Clay, Harlan, and Perry counties, and named for Preston Leslie, governor of Kentucky from 1871 to 1875.[3]
History[edit]
Leslie County was formed in 1878 from portions of Clay, Harlan, and Perry counties, and named for governor Preston Leslie.[4][5] Its county seat, Hyden, is named for state senator John Hyden, who was one of the commissioners that helped form the county.[6]
On December 30, 1970, a blast occurred at the Finley Mine on Hurricane Creek. The blast resulted in the deaths of 38 men. Following the recovery of bodies, an investigation revealed a failure to enforce new safety laws. Traces of dynamite and Primacord, were found inside the mine.[7]
After resigning the presidency, Richard Nixon made his first public appearance, in July 1978, at the Leslie County dedication of a recreation facility named for him. County Judge-Executive C. Allen Muncy claimed the Nixon invitation prompted the U.S. Department of Justice to obtain indictments of him and his associates on vote-fraud charges; while on appeal for his conviction, he won renomination in the Republican primary but lost the 1981 general election to independent Kermit Keen.[8]
Geography[edit]
According to the U.S. Census Bureau, the county has a total area of 404 square miles (1,050 km2), of which 401 square miles (1,040 km2) is land and 3.6 square miles (9.3 km2) (0.9%) is water.[9]
Adjacent counties[edit]
- Perry County (northeast)
- Harlan County (southeast)
- Bell County (southwest)
- Clay County (west)
Demographics[edit]
| Census | Pop. | Note | %± |
|---|---|---|---|
| 1880 | 3,740 | — | |
| 1890 | 3,964 | 6.0% | |
| 1900 | 6,753 | 70.4% | |
| 1910 | 8,976 | 32.9% | |
| 1920 | 10,097 | 12.5% | |
| 1930 | 10,765 | 6.6% | |
| 1940 | 14,981 | 39.2% | |
| 1950 | 15,537 | 3.7% | |
| 1960 | 10,941 | −29.6% | |
| 1970 | 11,623 | 6.2% | |
| 1980 | 14,882 | 28.0% | |
| 1990 | 13,642 | −8.3% | |
| 2000 | 12,401 | −9.1% | |
| 2010 | 11,310 | −8.8% | |
| 2020 | 10,513 | −7.0% | |
| 2023 (est.) | 9,864 | [10] | −6.2% |
| U.S. Decennial Census[11] 1790-1960[12] 1900-1990[13] 1990-2000[14] 2010-2021[15] | |||
As of the census[2] of 2000, there were 12,401 people, 4,885 households, and 3,668 families residing in the county. The population density was 31 per square mile (12/km2). There were 5,502 housing units at an average density of 14 per square mile (5.4/km2). The racial makeup of the county was 97.18% White, 0.07% Black or African American, 0.09% Native American, 0.12% Asian, 0.02% Pacific Islander, 0.05% from other races, and 0.50% from two or more races; 0.62% of the population were Hispanic or Latino of any race.
There were 4,885 households, out of which 35.50% had children under the age of 18 living with them, 58.30% were married couples living together, 12.90% had a female householder with no husband present, and 24.90% were non-families. 22.40% of all households were made up of individuals, and 8.70% had someone living alone who was 65 years of age or older. The average household size was 2.52 and the average family size was 2.94.
In the county, the population was spread out, with 24.60% under the age of 18, 9.20% from 18 to 24, 30.90% from 25 to 44, 23.90% from 45 to 64, and 11.50% who were 65 years of age or older. The median age was 36 years. For every 100 females there were 95.10 males. For every 100 females age 18 and over, there were 91.20 males.
The median income for a household in the county was $18,546, and the median income for a family was $22,225. Males had a median income of $28,708 versus $18,080 for females. The per capita income for the county was $10,429. About 30.20% of families and 32.70% of the population were below the poverty line, including 38.80% of those under age 18 and 27.00% of those age 65 or over.
Life expectancy and health[edit]
Of 3,142 counties in the United States in 2014, the Institute for Health Metrics and Evaluation ranked Leslie County 3,120 in the average life expectancy at birth of male residents and 3,130 in the life expectancy of female residents. Life expectancy in Leslie county ranked in the bottom 10 percent among U.S. counties. Males in Leslie County lived an average of 70.0 years and females lived an average of 74.7 years compared to the national average for life expectancy of 76.7 for males and 81.5 for females. In the 1980-2014 period, the average life expectancy in Leslie County for females decreased by 4.0 years while male longevity decreased by 0.1 years compared to the national average for the same period of an increased life expectancy of 4.0 years for women and 6.7 years for men. Factors contributing to the short, and declining, life expectancy of residents of Leslie county included obesity, smoking, and low amounts of exercise.[16][17]
In 2020, the Robert Wood Johnson Foundation ranked Leslie country 107 of 120 counties in Kentucky in "health outcomes," as measured by length and quality of life.[18]
Economy[edit]
Coal companies in Leslie County[edit]
Infrastructure[edit]
Transportation[edit]
Public transportation is provided by LKLP Community Action Partnership with demand-response service and scheduled service from Hyden to Hazard.[21]
Communities[edit]
Politics[edit]
Leslie County is one of forty-four United States counties[a] to have never voted for a Democratic presidential candidate since its creation in 1878. In 1892,[22] 1908, and 1916[23] it was the most Republican county in the nation. Leslie's fierce Unionist sympathies, so strong that areas surrounding it contributed more troops to the Union Army relative to population than any other part of the United States,[24] meant that between 1896 and 1928 no Democrat could receive even ten percent of the county's vote,[25] and none received so much as twenty-five percent until Lyndon Johnson managed over 47 percent in his landslide national triumph against Barry Goldwater in 1964.
Despite Goldwater's relatively poor performance, every Republican candidate since the county's formation has obtained an absolute majority in Leslie County, and only William Howard Taft in the divided 1912 election,[25] George H. W. Bush in 1992, and Bob Dole in 1996 have otherwise received under seventy percent for the GOP. Both Mitt Romney and Donald Trump received almost ninety percent of the vote in this county, making Leslie the strongest GOP county in Kentucky (see chart below).
| Year | Republican | Democratic | Third party | |||
|---|---|---|---|---|---|---|
| No. | % | No. | % | No. | % | |
| 2020 | 4,321 | 89.78% | 446 | 9.27% | 46 | 0.96% |
| 2016 | 4,015 | 89.38% | 400 | 8.90% | 77 | 1.71% |
| 2012 | 4,439 | 89.62% | 433 | 8.74% | 81 | 1.64% |
| 2008 | 3,574 | 81.28% | 766 | 17.42% | 57 | 1.30% |
| 2004 | 3,661 | 73.75% | 1,266 | 25.50% | 37 | 0.75% |
| 2000 | 3,159 | 71.24% | 1,210 | 27.29% | 65 | 1.47% |
| 1996 | 2,296 | 56.14% | 1,466 | 35.84% | 328 | 8.02% |
| 1992 | 2,879 | 58.33% | 1,591 | 32.23% | 466 | 9.44% |
| 1988 | 3,280 | 74.39% | 1,105 | 25.06% | 24 | 0.54% |
| 1984 | 3,385 | 75.64% | 1,075 | 24.02% | 15 | 0.34% |
| 1980 | 3,536 | 71.86% | 1,327 | 26.97% | 58 | 1.18% |
| 1976 | 3,770 | 71.52% | 1,478 | 28.04% | 23 | 0.44% |
| 1972 | 3,299 | 77.88% | 913 | 21.55% | 24 | 0.57% |
| 1968 | 2,615 | 71.08% | 828 | 22.51% | 236 | 6.41% |
| 1964 | 1,971 | 52.23% | 1,795 | 47.56% | 8 | 0.21% |
| 1960 | 3,894 | 83.05% | 795 | 16.95% | 0 | 0.00% |
| 1956 | 3,770 | 87.37% | 531 | 12.31% | 14 | 0.32% |
| 1952 | 3,239 | 81.81% | 705 | 17.81% | 15 | 0.38% |
| 1948 | 2,397 | 73.94% | 783 | 24.15% | 62 | 1.91% |
| 1944 | 2,679 | 84.30% | 499 | 15.70% | 0 | 0.00% |
| 1940 | 3,292 | 83.96% | 626 | 15.97% | 3 | 0.08% |
| 1936 | 2,716 | 81.39% | 618 | 18.52% | 3 | 0.09% |
| 1932 | 2,810 | 82.96% | 569 | 16.80% | 8 | 0.24% |
| 1928 | 2,806 | 94.45% | 159 | 5.35% | 6 | 0.20% |
| 1924 | 2,052 | 88.91% | 223 | 9.66% | 33 | 1.43% |
| 1920 | 2,576 | 94.22% | 142 | 5.19% | 16 | 0.59% |
| 1916 | 1,516 | 91.60% | 133 | 8.04% | 6 | 0.36% |
| 1912 | 606 | 52.97% | 105 | 9.18% | 433 | 37.85% |
Notable people[edit]
- Elmer Begley, secretary of state of Kentucky from 1968 to 1970
- Roger Bowling, songwriter
- Hugh X. Lewis, country music singer-songwriter
- William Lewis, former U.S. Representative from Kentucky
- Bobby Osborne, bluegrass musician
- Sonny Osborne, bluegrass musician
- Willie Sandlin, soldier in the U.S. Army who received the Medal of Honor for his actions in World War I
See also[edit]
References[edit]
- ^ "Find a County". National Association of Counties. Archived from the original on May 31, 2011. Retrieved June 7, 2011.
- ^ a b "U.S. Census website". United States Census Bureau. Retrieved January 31, 2008.
- ^ "Leslie County (KY) Free Blacks and Free Mulattoes, 1880-1910 · Notable Kentucky African Americans Database". nkaa.uky.edu. Retrieved July 6, 2023.
- ^ "Leslie County Kentucky - Historical". www.trailsrus.com. Retrieved July 6, 2023.
- ^ "Around Town!". Hyden & Leslie County. Retrieved July 6, 2023.
- ^ "Hyden, Kentucky". www.kyatlas.com. Retrieved July 6, 2023.
- ^ Martin, McKenzie. "Hurricane Creek Mine Disaster". ExploreKYHistory. Retrieved July 6, 2023.
- ^ "The Big Lever," Appalshop Inc., 1982
- ^ "2010 Census Gazetteer Files". United States Census Bureau. August 22, 2012. Archived from the original on August 12, 2014. Retrieved August 17, 2014.
- ^ "Annual Estimates of the Resident Population for Counties: April 1, 2020 to July 1, 2023". United States Census Bureau. Retrieved March 14, 2024.
- ^ "U.S. Decennial Census". United States Census Bureau. Retrieved August 17, 2014.
- ^ "Historical Census Browser". University of Virginia Library. Retrieved August 17, 2014.
- ^ "Population of Counties by Decennial Census: 1900 to 1990". United States Census Bureau. Retrieved August 17, 2014.
- ^ "Census 2000 PHC-T-4. Ranking Tables for Counties: 1990 and 2000" (PDF). United States Census Bureau. Archived (PDF) from the original on March 27, 2010. Retrieved August 17, 2014.
- ^ "State & County QuickFacts". United States Census Bureau. Archived from the original on June 7, 2011. Retrieved March 6, 2014.
- ^ "US Health Map". Institute of Health Metrics and Evaulation. University of Washington. Retrieved December 28, 2020.
- ^ "County Profiles: Leslie County, Kentucky" (PDF). Institute for Health Metrics and Evaluation. University of Washington. Archived (PDF) from the original on July 2, 2017. Retrieved December 28, 2020.
- ^ "2020 Kentucky Report". Robert Wood Johnson Foundation. Retrieved December 27, 2020.
- ^ James River Coal Company – Blue Diamond complex
- ^ James River Coal Company – Bledsoe complex
- ^ "LKLP Community Action Council, Inc. > Programs > Public Transportation". Retrieved May 19, 2015.
- ^ Góelections; Popular Vote at the Presidential Election of 1892
- ^ Dave Leip’s U.S. Election Atlas; 1916 Presidential Election Statistics
- ^ Marshall, Anne E.; Creating a Confederate Kentucky: The Lost Cause and Civil War Memory in a Border State, pp. 114-115 ISBN 1469609835
- ^ a b Robinson, Edgar Eugene; The Presidential Vote 1896-1932, p. 270 ISBN 9780804716963
- ^ Leip, David. "Dave Leip's Atlas of U.S. Presidential Elections". uselectionatlas.org. Retrieved July 3, 2018.
Notes[edit]
- ^ Thirty-eight counties have never voted Democratic since the Civil War, whilst Clinton County and Cumberland County in Kentucky last did so in 1868, while Mitchell County, North Carolina and Lewis County, Kentucky alongside Tennessee’s Henderson County and Wayne County last voted Democratic for Samuel J. Tilden in 1876.
External links[edit]
- The Kentucky Highlands Project
- LeslieCounty.Net - oldest and largest site dealing with Leslie County
Municipalities and communities of Leslie County, Kentucky, United States | ||
|---|---|---|
| City | 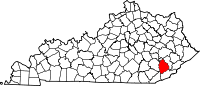 | |
| Unincorporated communities | ||
| post offices (and the creeks they are on) |
| |
| Counties | |
|---|---|
| Cities and towns Over 10k | |
| Cities and towns 5k-10k | |
| Cities and towns 1k-5k | |
| Cities and towns under 1k | |
| Statistical areas | |
| See also | |
37°05′N 83°23′W / 37.09°N 83.38°W
| International | |
|---|---|
| National | |
| Geographic | |